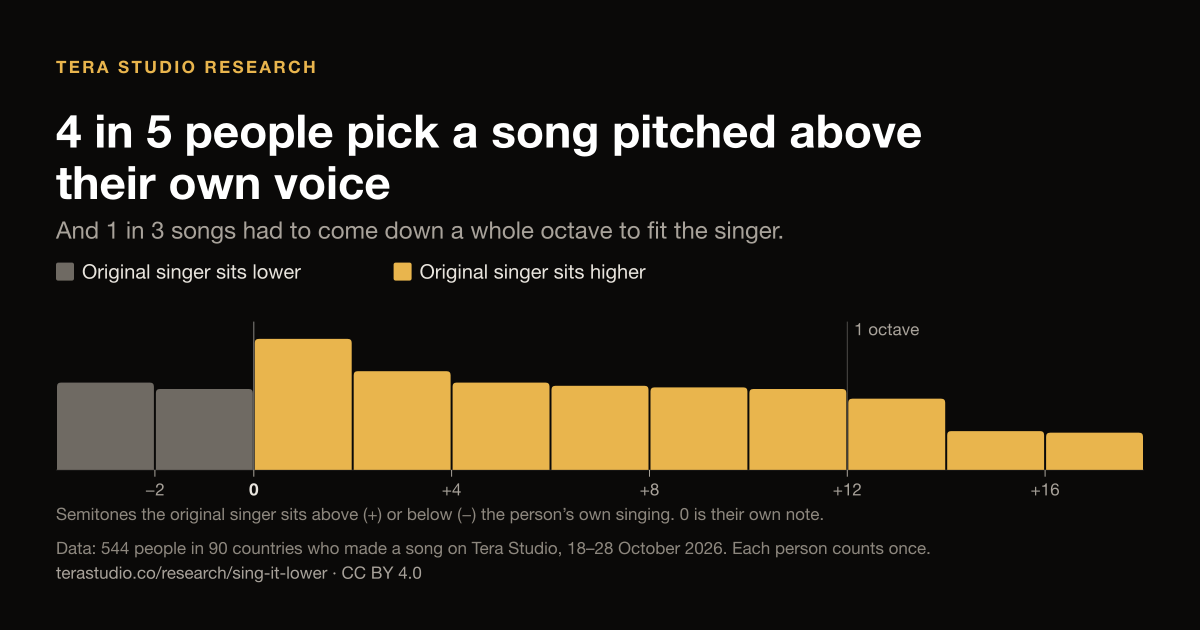
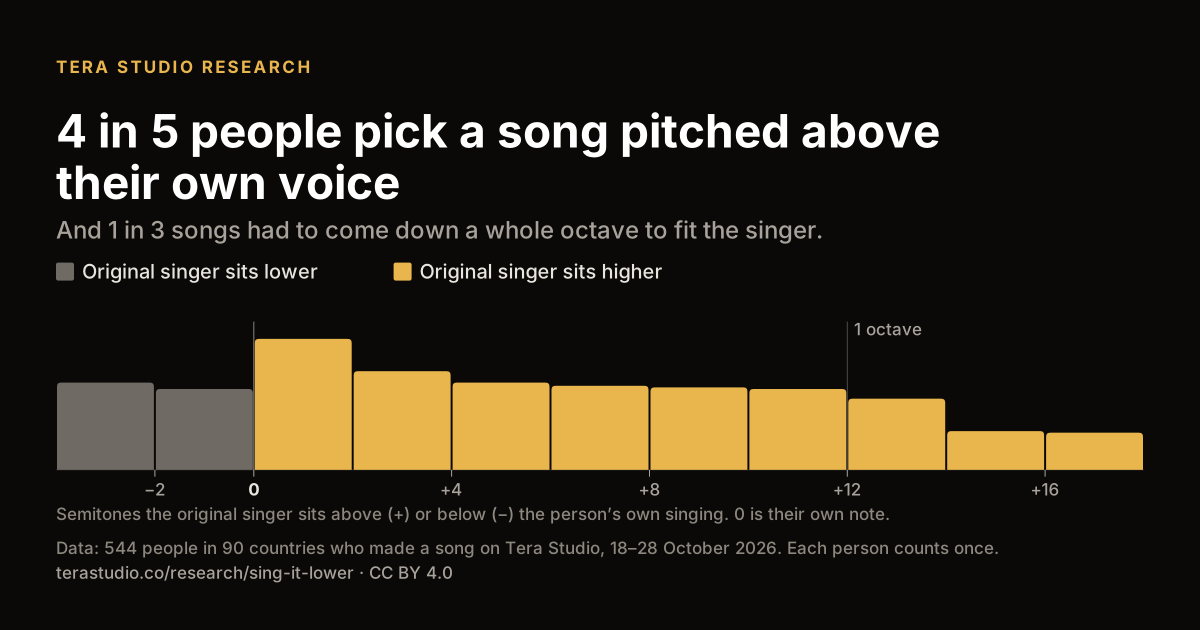
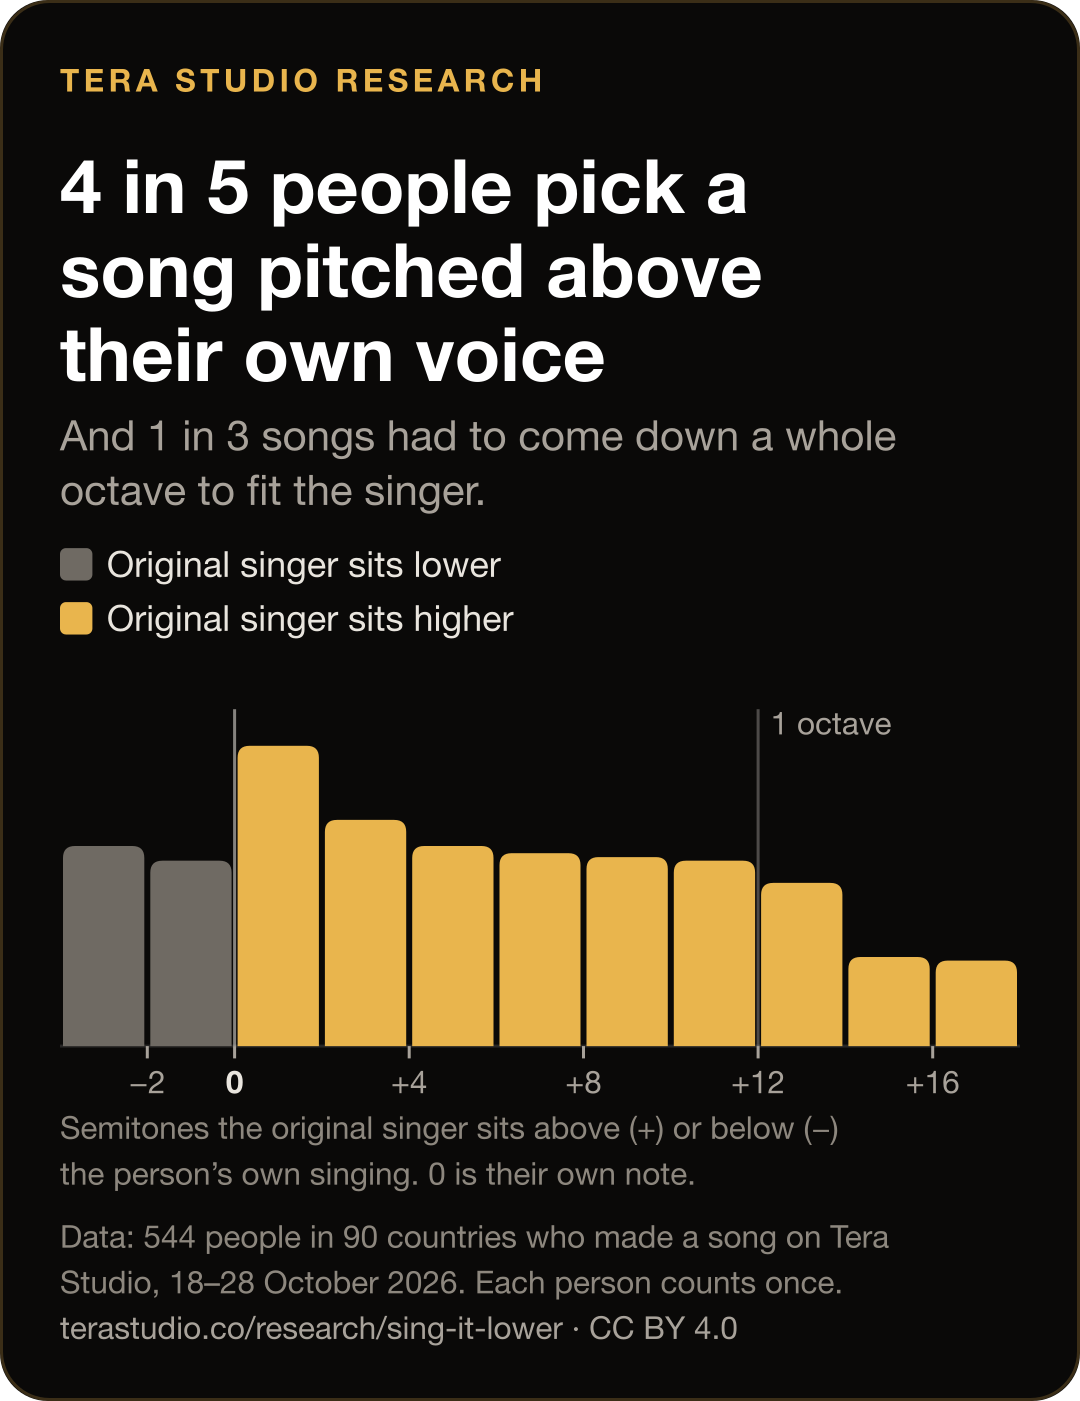
And 1 in 3 songs had to come down a whole octave to fit the singer. We compared 544 people’s own singing with the original singer of the song each one chose, in 90 countries.
Who this is. 544 people who made a song in their own voice on Tera Studio, 18–28 October 2026: people who chose to try a singing app, not a random sample of everyone who sings. Each person counts once, through their first song. Every group we show has at least 20 people.
Show the numbers
| Original singer, compared with the person | People |
|---|---|
| More than 2 semitones lower | 54 |
| −2 to 0 semitones | 50 |
| 0 to +2 semitones | 81 |
| +2 to +4 semitones | 61 |
| +4 to +6 semitones | 54 |
| +6 to +8 semitones | 52 |
| +8 to +10 semitones | 51 |
| +10 to +12 semitones | 50 |
| +12 to +14 semitones | 44 |
| +14 to +16 semitones | 24 |
| 16 or more semitones higher | 23 |
Embed or download this chart
Paste this into your page. The image links to this report and the line under it credits Tera Studio, as the CC BY 4.0 licence asks.
<a href="https://terastudio.co/research/sing-it-lower/"><img src="https://terastudio.co/research/sing-it-lower/headline.png" alt="Chart: 4 in 5 people pick a song pitched above their own voice, and 1 in 3 songs had to come down a whole octave to fit. 544 people in 90 countries, Tera Studio, 18–28 October 2026." width="1200" style="max-width:100%;height:auto"></a>
<p style="font-size:13px">Chart: <a href="https://terastudio.co/research/sing-it-lower/">Tera Studio, "Sing it lower" (2026)</a>, <a href="https://creativecommons.org/licenses/by/4.0/">CC BY 4.0</a></p>Download: PNG · SVG · phone-sized PNG
The numbers
- 80.5%picked a song whose original singer sits above their own singing (95% interval 77.0–83.6%).
- 31.6%of songs were moved a whole octave down to fit the person singing (27.9–35.6%).
- 64% vs 5%Low voices that chose a song led by a higher voice, against higher voices that chose a lower one.
- +5.1 semitonesis the median gap: the typical person sings about a fourth below the original singer.
Find your own key in about a minute
If most of us pick songs above our voice, the fix is usually to sing them lower. Sing a gentle “aah” from your lowest comfortable note to your highest: the test shows your range and voice type. It runs in your browser; nothing is recorded or uploaded.
- Move the song to your range. The free key changer lowers or raises any song by up to 6 semitones without changing its speed.
- An octave too high? Don’t strain: sing it a whole octave down. That’s what Tera Studio did for 32% of these songs.
- Or hear it in your own voice. Tera Studio sings the whole song in your voice, already moved to fit you: start with a free song.
1. Four in five pick a song above their own voice
For every person we compared the note their own singing centres on with the note the original lead singer of their chosen song centres on. For 438 of 544 people (80.5%, 95% interval 77.0–83.6%) the original singer sits higher. 87 (16.0%) are within a semitone, close enough to sing the song as it is, and 69 (12.7%) chose a song whose singer sits at least a semitone lower. A semitone is one step on a piano, black keys included; twelve make an octave.
What this doesn’t say: that anyone sings off key, or picks songs they can’t sing. We measured where voices sit, not how well anyone sings.
| Measure | Share | 95% interval | People |
|---|---|---|---|
| Original singer sits above the person | 80.5% | 77.0–83.6% | 438 of 544 |
| …by at least a semitone | 71.3% | 67.4–75.0% | 388 of 544 |
| Within a semitone either way | 16.0% | 13.2–19.3% | 87 of 544 |
| Original singer at least a semitone below | 12.7% | 10.1–15.7% | 69 of 544 |
2. One song in three had to come down a whole octave
When a song’s original singer sits 7.5 semitones or more above someone, Tera Studio moves the whole song down an octave so it lands in their voice. It did that for 172 of 544 songs (31.6%, 27.9–35.6%) and moved 11 (2.0%) up an octave. The 205 people whose song sat that far above them had a median gap of +11.5 semitones: almost exactly an octave, which is 12. The product only moves a song when two independent readings of the pitch agree, which is why fewer songs were moved than sat 7.5 or more semitones above.
| Measure | Share | 95% interval | People |
|---|---|---|---|
| Song moved a whole octave down | 31.6% | 27.9–35.6% | 172 of 544 |
| Song moved a whole octave up | 2.0% | 1.1–3.6% | 11 of 544 |
| Original singer 7.5+ semitones above the person | 37.7% | 33.7–41.8% | 205 of 544 |
| Original singer 7.5+ semitones below the person | 3.1% | 2.0–4.9% | 17 of 544 |
3. It’s the same everywhere
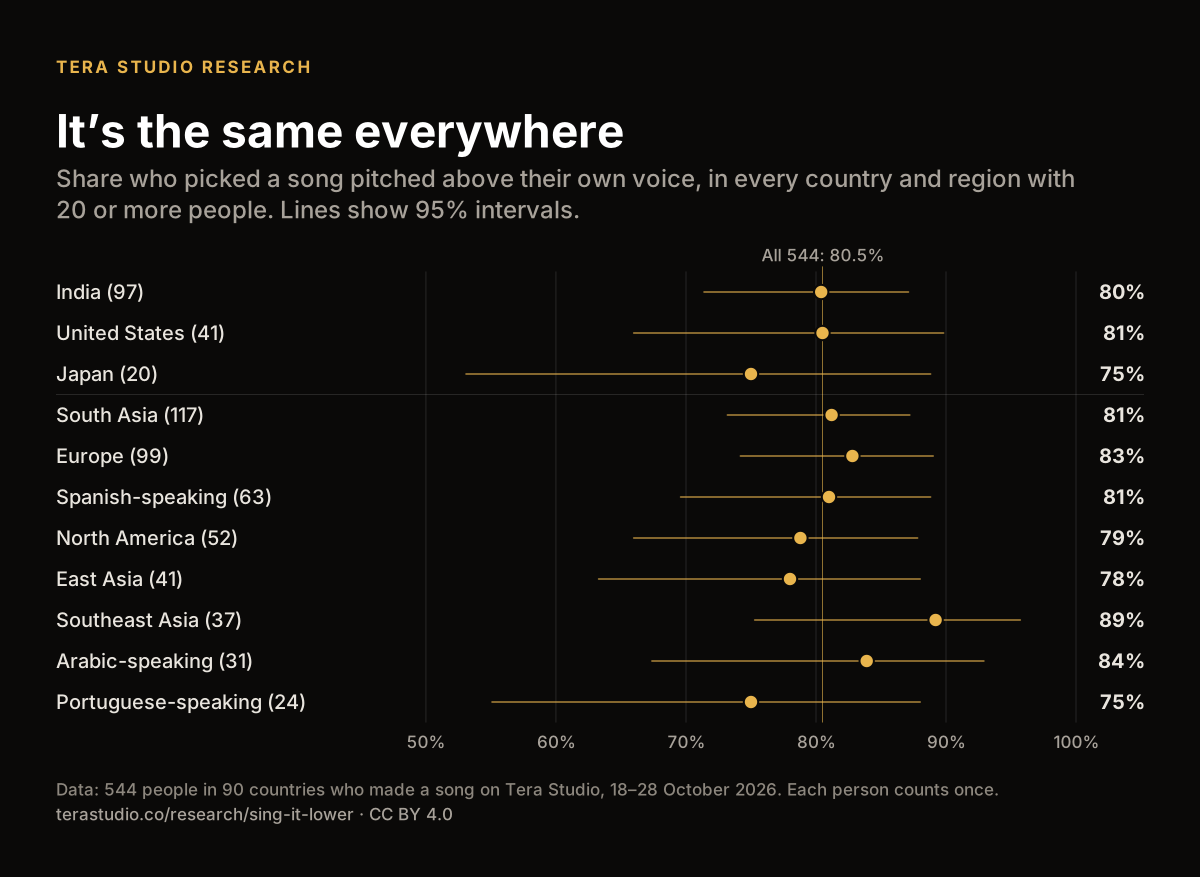
In every country and region with at least 20 people, between 75% and 89% picked a song pitched above their own voice, and every 95% interval overlaps the others. This is not a ranking: differences between places mostly reflect who uses Tera Studio there. India, United States and Japan are the only single countries with 20 or more people so far.
Show the numbers
| Country or region | Song above their voice | 95% interval | Median gap | People |
|---|---|---|---|---|
| India | 80.4% | 71.4–87.1% | +5.6 st | 97 |
| United States | 80.5% | 66.0–89.8% | +5.6 st | 41 |
| Japan | 75.0% | 53.1–88.8% | +2.7 st | 20 |
| South Asia | 81.2% | 73.2–87.2% | +5.5 st | 117 |
| Europe | 82.8% | 74.2–89.0% | +5.2 st | 99 |
| Spanish-speaking countries | 81.0% | 69.6–88.8% | +4.1 st | 63 |
| North America | 78.8% | 66.0–87.8% | +6.4 st | 52 |
| East Asia | 78.0% | 63.3–88.0% | +2.8 st | 41 |
| Southeast Asia | 89.2% | 75.3–95.7% | +6.9 st | 37 |
| Arabic-speaking countries | 83.9% | 67.4–92.9% | +7 st | 31 |
| Portuguese-speaking countries | 75.0% | 55.1–88.0% | +3.5 st | 24 |
Embed or download this chart
Paste this into your page. The image links to this report and the line under it credits Tera Studio, as the CC BY 4.0 licence asks.
<a href="https://terastudio.co/research/sing-it-lower/"><img src="https://terastudio.co/research/sing-it-lower/same-everywhere.png" alt="Chart: in every country and region with 20 or more people, between 75% and 89% picked a song pitched above their own voice. Tera Studio, 18–28 October 2026." width="1200" style="max-width:100%;height:auto"></a>
<p style="font-size:13px">Chart: <a href="https://terastudio.co/research/sing-it-lower/">Tera Studio, "Sing it lower" (2026)</a>, <a href="https://creativecommons.org/licenses/by/4.0/">CC BY 4.0</a></p>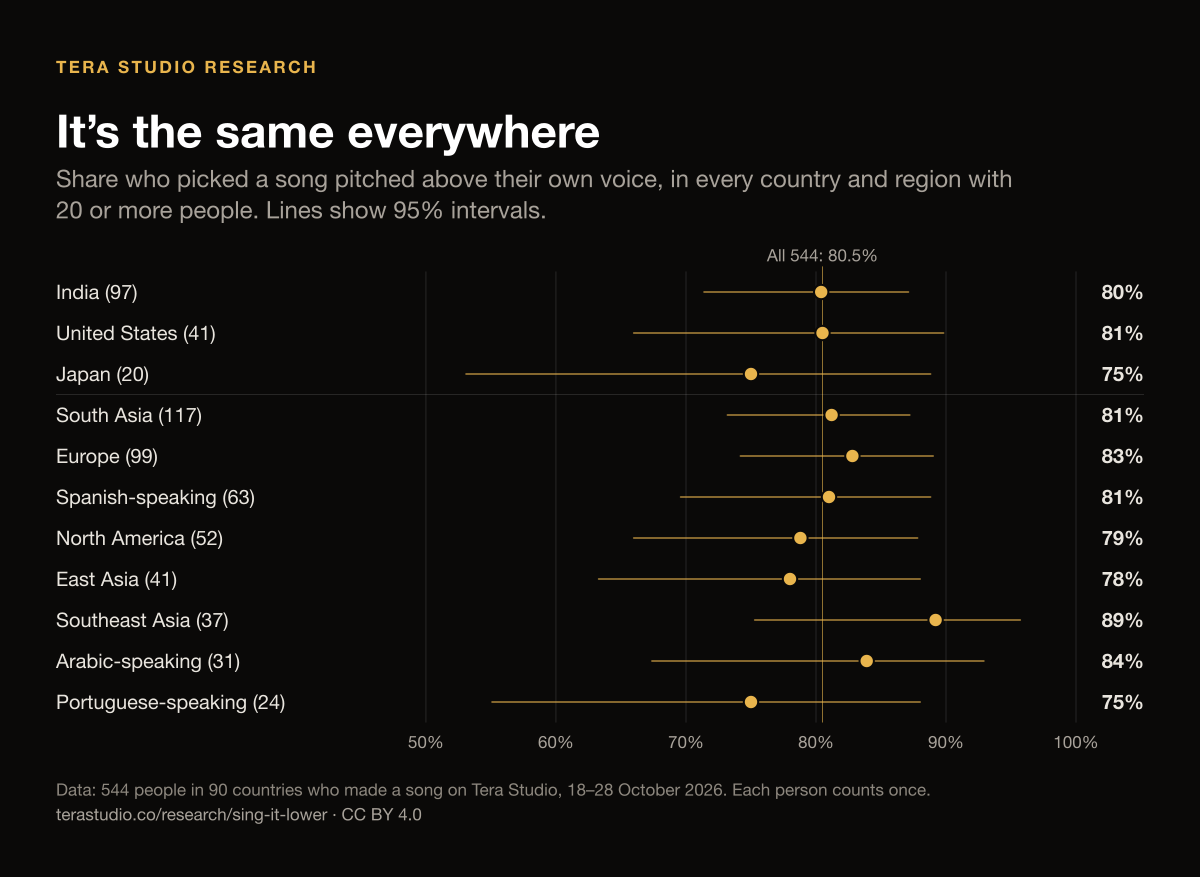
4. Low voices reach up; higher voices don’t reach down
We split singers at E3 (165 Hz). Of the 242 people whose singing centres below it, 155 (64.0%, 57.8–69.8%) chose a song whose original lead sits at A3 (220 Hz) or higher. Of the 302 at E3 or above, only 15 (5.0%, 3.0–8.0%) chose a lead below E3. We don’t know anyone’s sex or gender and don’t guess it: plenty of male pop singers sing at A3 and above too.
Show the numbers
| Measure | Share | 95% interval | People |
|---|---|---|---|
| Singing under E3, chose a lead at A3 or higher | 64.0% | 57.8–69.8% | 155 of 242 |
| Singing at E3 or above, chose a lead under E3 | 5.0% | 3.0–8.0% | 15 of 302 |
Embed or download this chart
Paste this into your page. The image links to this report and the line under it credits Tera Studio, as the CC BY 4.0 licence asks.
<a href="https://terastudio.co/research/sing-it-lower/"><img src="https://terastudio.co/research/sing-it-lower/low-voices.png" alt="Chart: 64% of people with a low singing voice chose a song led by a higher voice; 5% of people with a higher voice did the reverse. Tera Studio, 18–28 October 2026." width="1200" style="max-width:100%;height:auto"></a>
<p style="font-size:13px">Chart: <a href="https://terastudio.co/research/sing-it-lower/">Tera Studio, "Sing it lower" (2026)</a>, <a href="https://creativecommons.org/licenses/by/4.0/">CC BY 4.0</a></p>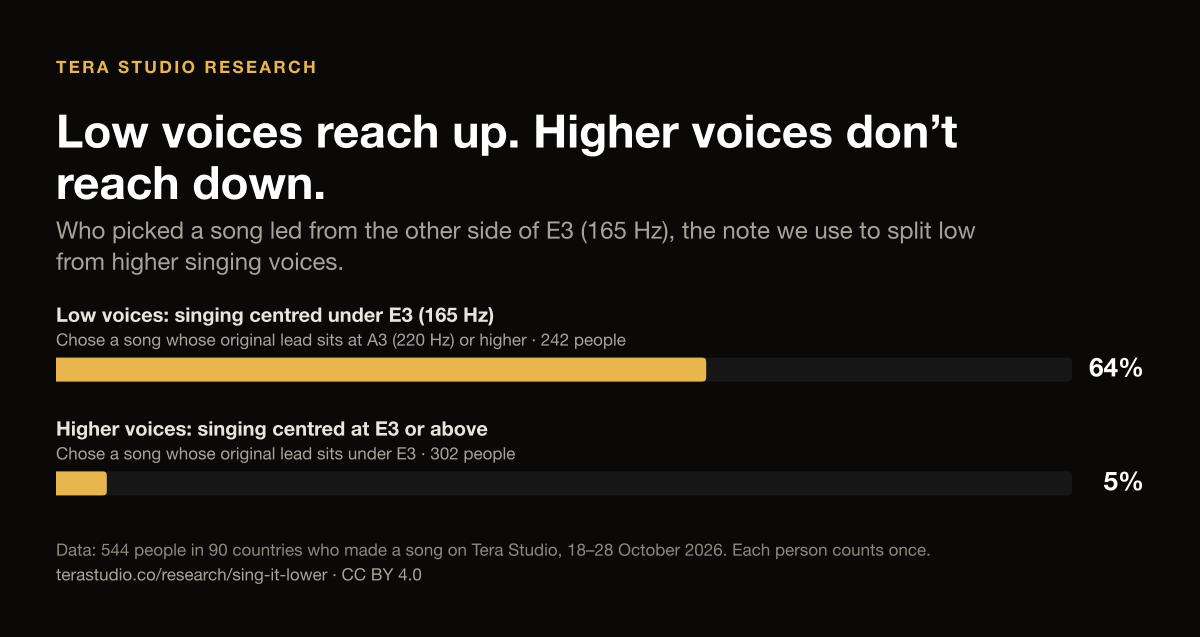
5. The typical singer sits a third to a fourth below the record
The median gap is +5.1 semitones, about a musical fourth. Half of all gaps fall between +0.5 and +10.1 semitones. People’s own singing centres on 173.7 Hz (about F3) and the songs they chose on 253.2 Hz (about B3); the median of everyone’s gap is not the same as the gap between those two medians. Read the other two ways below, the median gap is +3.8 and +3.4 semitones, so the safe summary is 3 to 5 semitones: a third to a fourth.
Three ways of reading the pitch
Reading a voice’s pitch means choosing the lowest pitch to look for. Our main reading looks down to 70 Hz. We repeated everything looking only down to 110 Hz, and again with only the people whose two readings agree within a semitone. The findings hold under all three.
| Reading | People | Song above their voice | 7.5+ semitones above | Median gap | Low voices reaching up | Higher voices reaching down |
|---|---|---|---|---|---|---|
| Main reading (70 Hz pitch floor) | 544 | 80.5% | 37.7% | +5.1 st | 64.0% of 242 | 5.0% of 302 |
| Read with a 110 Hz pitch floor | 543 | 77.0% | 32.6% | +3.8 st | 64.6% of 209 | 5.7% of 334 |
| Only people whose two readings agree | 429 | 78.3% | 30.3% | +3.4 st | 65.5% of 148 | 4.3% of 281 |
How we measured it
- Who. Everyone who made a song on Tera Studio from 18 to 28 October 2026, the first days the product saved this measurement. Only each person’s first song counts, so nobody counts twice. We left out our own staff and test accounts and every song its maker deleted, which leaves 544 people. They chose to try making a song in their own voice, so they are not a random sample of everyone who sings.
- Their voice. Before making a song, each person records a take: “Sing the song you picked, or any song you love”, for about two minutes. We read its pitch every 20 milliseconds over its first four minutes (Praat’s autocorrelation method), keep the moments that are sung, at least 50 of them, and take the median: the note their singing centres on. Because the take can be any song, this is where a person’s voice sits when they sing something they like, not their full range.
- The song. We separate the lead vocal from the recording of the song they chose and read its pitch the same way.
- The gap is the distance between the two, in semitones: 12 × log2(song pitch ÷ voice pitch). Positive means the original singer sits higher. 2 people sit at exactly 0, so the chart’s bars from 0 up hold 440 people while “above” counts 438.
- Moving a song an octave. When the original lead sits 7.5 semitones or more above or below the person, Tera Studio moves the song an octave toward their voice, but only when its two pitch readings (looking down to 70 Hz and to 110 Hz) agree within a semitone for both the voice and the song.
- Country comes from the person’s IP address when they signed up, looked up in a country database on our own server; for accounts made before we kept that, it is the most common country of their own visits. 529 of 544 people have one. Regions: South Asia (IN, PK, BD, LK, NP); Europe (DE, FR, IT, ES, NL, BE, AT, CH, GB, IE, PT, SE, NO, DK, FI, PL, CZ, RO, GR, HU); Spanish-speaking countries (ES, MX, AR, CO, EC, PE, CL, VE, DO, GT, BO, UY, PY, CR, PA, SV, HN, NI, CU, PR); North America (US, CA); East Asia (JP, KR, TW, CN, HK); Southeast Asia (ID, PH, TH, VN, MY, SG); Arabic-speaking countries (SA, EG, DZ, MA, IQ, AE, JO, KW, QA, OM, BH, LB, TN, LY, SY, YE, PS, SD); Portuguese-speaking countries (BR, PT, AO, MZ). Spain and Portugal count in both their language group and Europe.
- Uncertainty. Every share carries a 95% Wilson score interval. A median or percentile is the value at rank round(q × (n − 1)) of the sorted values.
- Privacy. Only totals leave our servers: never a recording, name, email or account, and no group under 20 people. Our privacy policy says so.
- Limits. One take of about two minutes per person; a median note, not a range; a lead vocal separated by software, which can catch a harmony or a second singer; and 544 people over a few days. We will update this page as more people sing, and the CSV carries the date of its data.
Use it: CC BY 4.0
The charts, the numbers and the CSV are free to use for anything, including commercially, under Creative Commons Attribution 4.0. Credit Tera Studio, “Sing it lower” (2026) and link to this page.
- Download the data (CSV): every number on this page, with its 95% interval and the date of the data.
- 4 in 5 people pick a song pitched above their own voice: PNG · SVG · embed code
- It’s the same everywhere: PNG · SVG · embed code
- Low voices reach up. Higher voices don’t reach down.: PNG · SVG · embed code
Tera Studio (2026). Sing it lower: how high people sing compared with the songs they choose. https://terastudio.co/research/sing-it-lower/
Questions and data requests
Email teralabsx@gmail.com or use our contact page. We can rerun a different cut of the data as long as every group still holds 20 or more people.
Data as of 28 October 2026, 12:41 UTC. Published 28 October 2026.